Posts

Are We There Yet?

Image
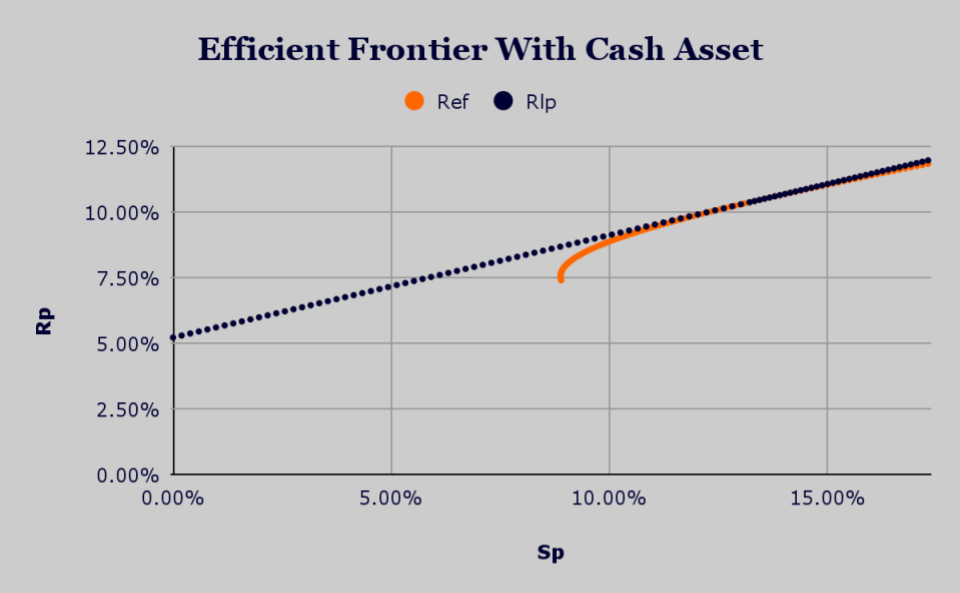
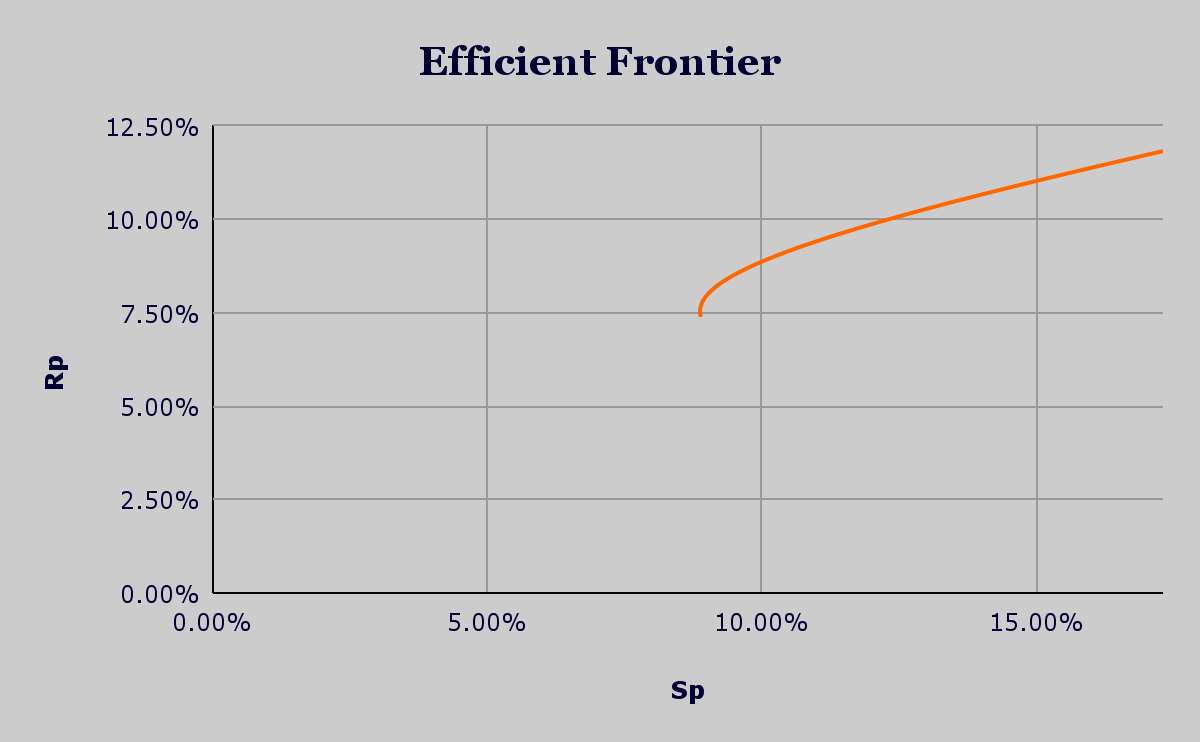
  Are We There Yet? When my kids were young, they would always ask: “How much longer?” My standard answer was: “5 more minutes.” After many of these exchanges, I would respond with: “6 more minutes” and then “7 more minutes.” T hey finally figured out that I really had no idea how much longer. This week we try to answer the economic question: “Are we there yet?” From an investing perspective, I think we are currently in a “Goldilocks” moment for three reasons: (1) inflation has seemingly been tamed to provide price stability, (2) unemployment rates are near all-time lows, and (3) the economy continues to expand. We are long term investors who employ a strategic asset allocation that assures our clients are always "in" the market. We do not believe that a market timing approach works well for anyone who cannot accurately forecast the future (translation: all mere mortals). We will discuss this in detail in our blog next week. Last week we introduced a cash position to our eff...

Adding A Cash Position

Image
Adding A Cash Position Last week we introduced the concept of an efficient frontier. This set of portfolios creates a curve in the return vs. risk space that sometimes resembles a rocket taking off from the ground and bending toward orbit. It seemingly asymptotes to a nearly linear reward for risk trade-off at the upper ranges of typical asset class annualized risk measurements. This week, we added one layer of complexity by adding a cash position to our traditional two asset (bonds and stocks) portfolio. A cash position can help us reduce our risk or increase our expected returns for most expected risk levels.   Source : JQR Capital The Market Portfolio The easiest way to visualize adding cash to our set of bond and stock portfolios is to plot the expected interest yield on a cash asset along the y-axis of our return vs. risk space. We then imagine a vertical line “falling” from that pivot point down onto our now familiar efficient frontier of bond and stock portfolios. The landin...

Introducing The Efficient Frontier

Image
Introducing The Efficient Frontier Last week we looked at the jelly bean chart and how it can visually describe the periodic (annual, in this case) returns of various market asset classes over time. This week we introduce a different framework based on the return vs. risk trade off facing investors at every decision point. A rational investor wants more portfolio return (Rp) for a fixed level of risk or less portfolio risk (Sp) for a fixed level of return. In an ideal world, we desire both more return AND less risk. The chart shown below shows this basic trade off.   Source : JQR Capital Return / Risk Framework The 11 asset classes shown in the jelly bean chart from last week are one way to split up the investment universe. That chart consisted of one cash asset class, five bond asset classes, and five stock asset classes. For this post, we start by first simplifying our investment universe into two main asset classes: bonds (as measured by the ICE BofA US Corporate Index) and stoc...

The Jelly Bean Chart

Rank 2014 2015 2016 2017 2018 2019 2020 2021 2022 2023 1 SPTL 21.76% SPTI 00.40% SPSM 18.11% SPEM 33.21% SPTI 00.24% SPLG 29.48% SPTL 15.90% SPLG 27.67% BIL 00.04% SPLG 24.28% 2 SPLG 11.62% SPTS 00.07% SPMD 15.59% SPDW 23.35% BIL 00.07% SPSM 23.79% SPLG 15.63% SPSM 25.04% SPTS -05.06% SPMD 14.64% 3 SPBO 04.78% BIL -00.13% SPEM 09.98% SPLG 19.05% SPTS -00.97% SPMD 23.15% SPEM 12.29% SPMD 23.33% SPTI -11.89% SPDW 14.55% 4 EW 03.71% SPLG -00.83% SPLG 09.54% SPSM 13.60% SPTL -04.24% SPDW 18.53% SPMD 11.32% SPDW 07.33% SPMD -14.56% SPSM 14.09% 5 SPHY 03.26% SPTL -04.09% SPHY 07.48% SPMD 12.78% SPBO -05.21% SPEM 16.16% SPSM 09.53% EW 06.72% SPHY -15.92% EW 08.41% 6 SPSM 03.03% SPDW -04.28% EW 05.93% EW 11.10% SPLG -06.71% EW 14.32% EW 08.89% SPHY 00.34% EW -17.12% SPEM 07.43% 7 SPMD 02.22% SPBO -04.41% SPBO 01.84% SPTL 06.21% SPHY -07.11% SPTL 10.93% SPDW 08.42% BIL -00.09% SPSM -17.27% SPHY 04.66% 8 SPTI 01.42% EW -05.17% BIL 00.04% SPHY 02.70% EW -07.93% SPBO 10.66% SPBO 07.01% SPTS -00.85...