Introducing The Efficient Frontier
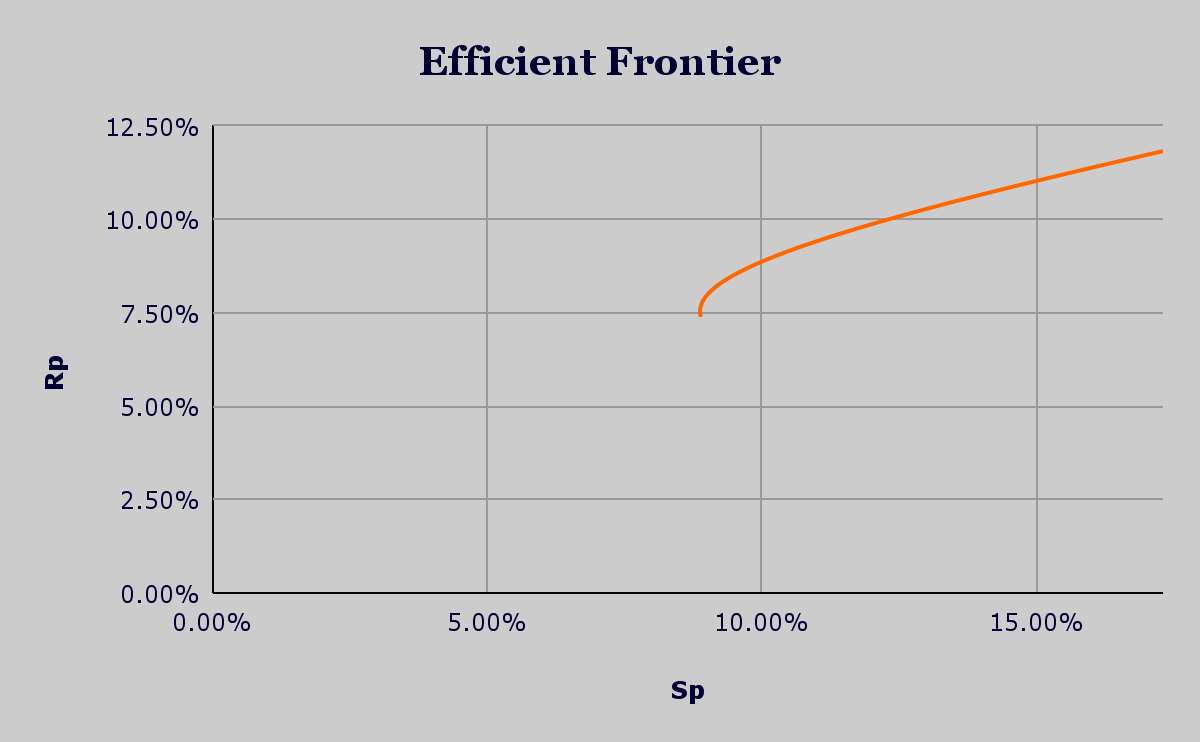
Introducing The Efficient Frontier Last week we looked at the jelly bean chart and how it can visually describe the periodic (annual, in this case) returns of various market asset classes over time. This week we introduce a different framework based on the return vs. risk trade off facing investors at every decision point. A rational investor wants more portfolio return (Rp) for a fixed level of risk or less portfolio risk (Sp) for a fixed level of return. In an ideal world, we desire both more return AND less risk. The chart shown below shows this basic trade off. Source : JQR Capital Return / Risk Framework The 11 asset classes shown in the jelly bean chart from last week are one way to split up the investment universe. That chart consisted of one cash asset class, five bond asset classes, and five stock asset classes. For this post, we start by first simplifying our investment universe into two main asset classes: bonds (as measured by the ICE BofA US Corporate Index) and stoc...