Strategic Versus Tactical Asset Allocation

Source: FRED Data, JQR Capital
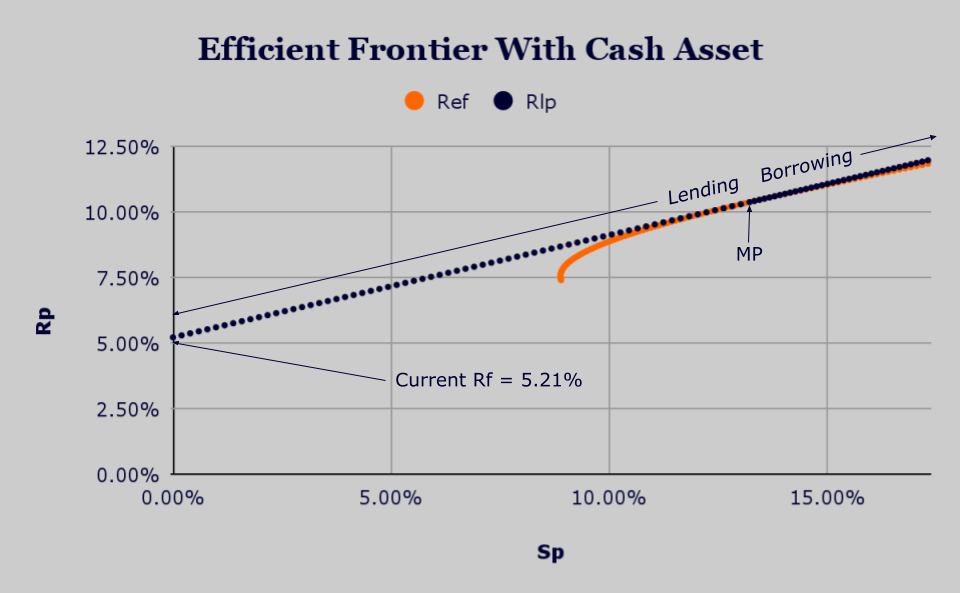
The Market Portfolio
A few weeks ago we introduced a cash asset to augment our efficient frontier set of bond plus stock portfolios.The cash asset allowed us to combine cash with the one portfolio along the efficient frontier that had the highest return versus risk (AKA the Sharpe Ratio). This one portfolio can be thought of as the tangency portfolio or - more commonly - the market portfolio (MP). The mix of bonds versus stocks in the MP will change over time with changes in interest rates and changes in expected returns for our bond and stock indices. The chart below is a quick snapshot of how the risk free rate of cash interest (Rf) interacts with the efficient frontier to create the market portfolio (MP) at only one point in time. This snapshot was taken a few weeks ago.
Source: FRED Data, JQR Capital
Introducing Naive Forecasting
The chart shown above was generated using average return and risk data over the 1973 to 2022 time period. The hardest thing in finance - or any profession, for that matter - is the art of predicting the future. Here we introduce the idea of a naive forecast based on historical return data (please see the important disclaimer shown below). Because the FRED data for our bond and stock indices does not start until the end of 1972, we need to use our imagination when creating a history of predictions as inputs for the efficient frontier at any one point in time. Our first guess is to use averages over past periods to predict future periods (please see the important disclaimer shown below- AGAIN). In this case, we will assume that 10 years of history is enough to get our prediction pattern started. From that starting point, we will use each successive year to update and “refine” our predictions. When continuing this process over the 1983 to 2022 period, we generate the following chart.

Source: FRED Data, JQR Capital
This chart shows the predicted returns for our risk free asset (Rf), our bonds (Rb), and our stocks (Rs) using this naive approach. The sampling period was every year between 1982 and 2022. Because we used a yearly sampling period, we chose to use a 1-year constant maturity Treasury bill as our risk free asset. The predicted returns are one of the three inputs that generates the predicted efficient frontier. The other two are the predicted risk and the predicted correlation between our bonds and stocks. Most practitioners spend all of their time on the expected returns estimate and use historical averages to fill out the expected risk and expected correlations. Once we have these three predicted inputs to our efficient frontier at any one point in time, we can calculate our market portfolio at that point in time.

Source: FRED Data, JQR Capital
The chart above shows the calculated allocations for the market portfolio at each point in time over the 1982 to 2022 time period. The two allocations of bonds and stocks add up to 100% for each portfolio and we can see the comparison with the 60/40 portfolio over time. You may note that these allocations differ significantly from the “standard” 60/40 allocations due to changes in our input estimations over time. Again, we used yearly sampling to reduce our computational efforts. Quarterly or monthly sampling might show less dramatic periodic swings in the allocations.
The Predicted Performance
Once we have the predicted allocations for our market portfolio over time, we can compare the performance of these market portfolios to that for our strategic 60/40 allocation of stocks and bonds. We plug in the actual annual returns during the 1983 to 2022 periods and compare the values in the chart down below.
Source: FRED Data, JQR Capital
There are a few important lessons from this comparison: (1) either asset allocation approach would have generated a significant amount of wealth over a 40 year period, (2) they both - coincidentally - would have finished the 40 year period with almost the same amount of value, and (3) it would appear that the tactical asset allocation approach (using the MP) would have experienced less risk (smoother ride) over the 40 year period. This is just one example of a tactical asset allocation (TAA) process. In our next blog post, we will compare the market portfolio TAA approach to at least one other TAA process over time. Please stay tuned!
Compound interest is the eighth wonder of the world. [Those] who understand it, earn it. [Those] who [do not], pay it. - Albert Einstein
JQR Capital offers you a complimentary one hour consultation to “Find Your Bearings” in your lifelong financial voyage. Please click the link shown below to accept this offer.
Disclaimer
Past performance is no guarantee of future results. Any investment involves some amount of risk and may not be suitable for all — or any — individuals. You should consult with your investment advisor before acting on this — or any — financial information.
References
https://jqrcapital.blogspot.com/2024/01/adding-cash-position.html
Copyright © 2024 JQR Capital Management, LLC


Comments
Post a Comment