Markets 101
 What Is A Market?
The following is a very good definition from Investopedia.
A market is a place where two parties can gather to facilitate the exchange of goods and services. The parties involved are usually buyers and sellers. The market may be physical like a retail outlet, where people meet face-to-face, or virtual like an online market, where there is no direct physical contact between buyers and sellers. The term market also takes on other forms. For instance, it may refer to the place where securities are traded—the securities market. Alternatively, the term may also be used to describe a collection of people who wish to buy a specific product or service such as the Brooklyn housing market or as broad as the global diamond market.
Source: https://www.investopedia.com/terms/m/market.asp
How Many Markets Exist?
In a word, gazillions! There are physical markets for commodities such as coffee, wheat, and sugar. There are hybrid markets where commerce is conducted, but the physical goods are not exchanged on site. And, there are fully electronic markets which allow those with technical skills to conduct transactions within a millisecond. The Amsterdam Stock Exchange was founded in 1602 by the Dutch East India Company and it is considered the oldest securities market in the world. Since that time, much of the trading on exchanges has been analog in nature with the smallest prices being described in 1/8ths of a dollar. Fast forward to 2021 and we see that decimalization and colocation have ushered in the digital age of algorithmic trading and machine learning. For exchange traded securities, there are a handful of markets across the globe.
- Global Stocks - $89.5T
- Global Real Estate - $280.6T
- Global Bonds - $253T
- Global Gold - $10.9T
- Global Cash- $95.7T
Source: https://www.visualcapitalist.com/all-of-the-worlds-money-and-markets-in-one-visualization-2020/
The global size of these markets is measured in trillions of dollars and when we add in derivatives to the underlying markets shown above, the tally reaches above the $ quadrillion level. The chart below shows just how small the stock markets are on a relative scale when compared to real estate and bonds. The real estate asset contains three main components: residential, raw land, and commercial. Some of the global bond market is mortgage debt - offsetting a portion of the total value in the real estate slice.

How Do Markets Behave?
Different markets behave, well - differently. This is a good thing because a variety of return patterns over time helps to smooth out the ride for our investment portfolios. There are three main properties that help us understand markets and we will focus our attention to just the five major asset classes listed above.
Returns
Returns are the most important metric that interest us as investors. Strongly positive returns over a long period of time help us build wealth that can combat the effects of inflation eating away at our earning power. The chart shown below indicates that stocks (using the Morningstar US index as a proxy) have generated the highest total returns over the past 25 years.
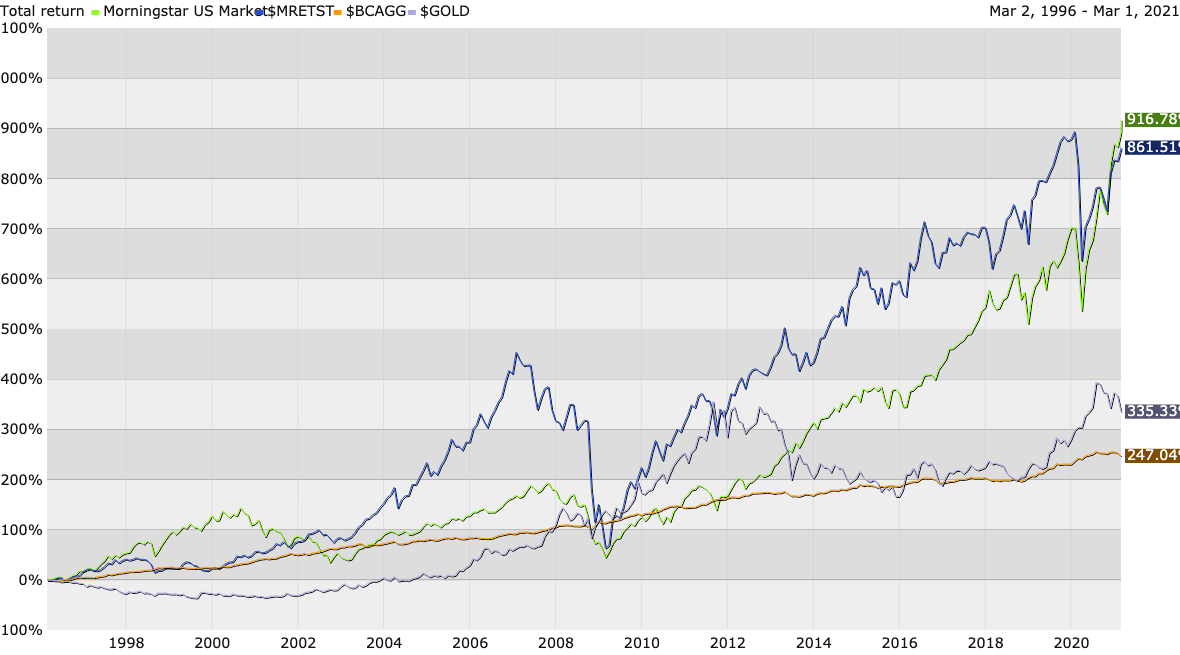
Source: Kwanti
Volatilities
Relative volatilities describe the inconsistency of returns. This can be thought of as the bounciness on the ride from investing in any one asset class, or market. The following chart shows annual returns for our five different markets plotted against volatility over the same 25 year period. Markets further to the right have generated more volatile return patterns, while markets on the left side have been less risky over that time. We can see that the US aggregate bond market ($BCAGG) has been the least volatile asset class. 90-day Treasuries would show up on this chart in the lower left corner.

Source: Kwanti
Correlations
The most subtle metric about market behavior - and perhaps one of the most important to remember - is that certain markets tend to move in different directions when compared to each other over time. These imperfect correlations allow us to invest in a variety of markets in the hope of smoothing our ride toward higher wealth. The table below shows that stocks ($MSTART) have a high correlation of returns when compared to real estate ($MRETST). Correlations range on a scale from -1.00 to +1.00 with lower values offering better diversification and smoother portfolio returns over time. Gold and stocks have shown very low correlations (0.07) to one another over the past 25 years. The returns of 90-day Treasuries (BIL) experienced negative correlations with both stocks and real estate during this time.

Source: Kwanti


Comments
Post a Comment