Posts

Strategic Versus Tactical Asset Allocation
Image
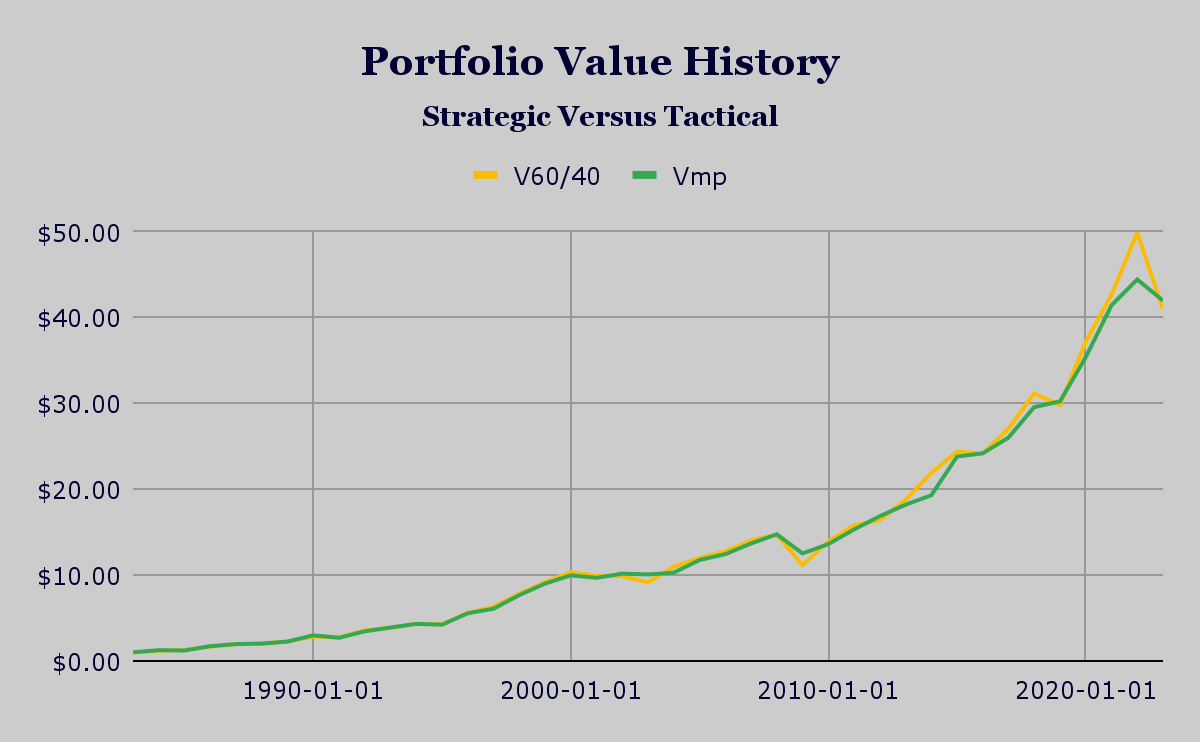
  Source : FRED Data, JQR Capital The Market Portfolio A few weeks ago we introduced a cash asset to augment our efficient frontier set of bond plus stock portfolios.The cash asset allowed us to combine cash with the one portfolio along the efficient frontier that had the highest return versus risk (AKA the Sharpe Ratio). This one portfolio can be thought of as the tangency portfolio or - more commonly - the market portfolio (MP). The mix of bonds versus stocks in the MP will change over time with changes in interest rates and changes in expected returns for our bond and stock indices. The chart below is a quick snapshot of how the risk free rate of cash interest (Rf) interacts with the efficient frontier to create the market portfolio (MP) at only one point in time. This snapshot was taken a few weeks ago. Source : FRED Data, JQR Capital Introducing Naive Forecasting  The chart shown above was generated using average return and risk data over the 1973 to 2022 time period. The...
Asset Allocation Historical Performance

Image
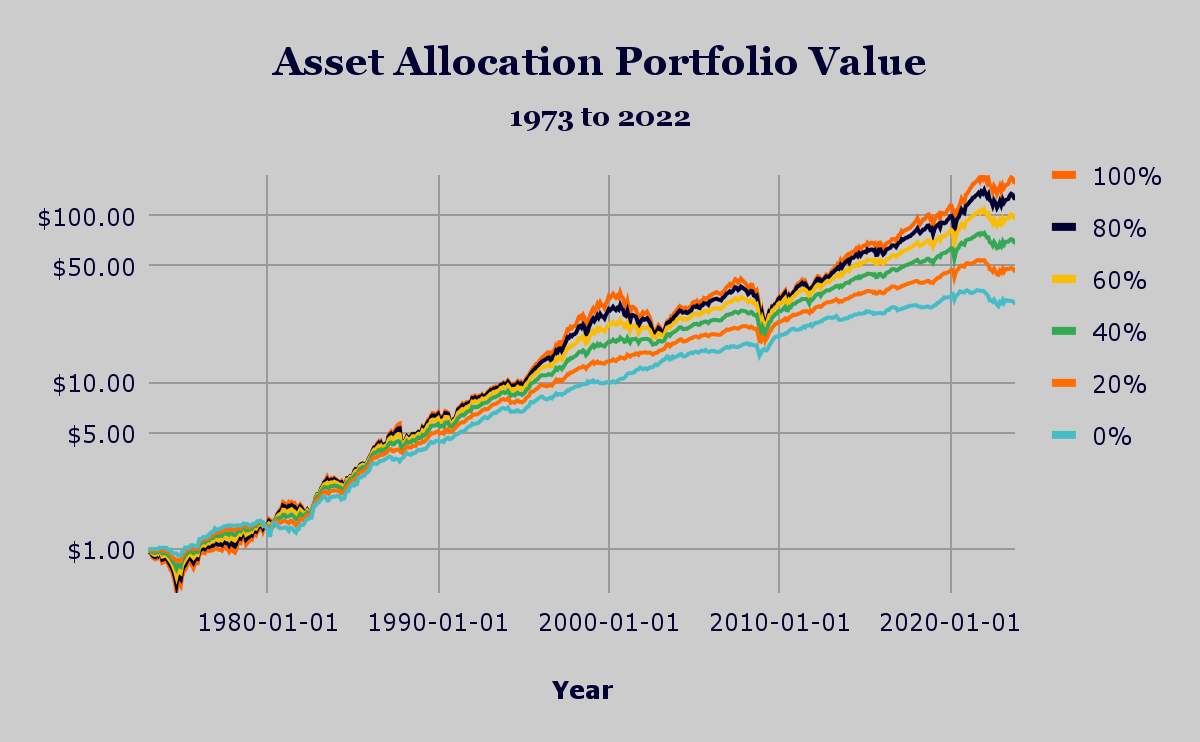
  Source : FRED Data, JQR Capital Asset Allocation Historical Performance Last time we examined the accuracy of investment “experts” (AKA market gurus) in predicting the future movements of the stock market. Numerous studies have shown that very few of these experts were able to accurately add value when compared to the proverbial coin toss over a long period of time. In this post we are going to simplify our asset allocation back to our two risky asset cases - stocks vs. bonds (and combinations thereof). The chart shown above displays the historical performance for several combinations of stocks and bonds over the last 50 years. It is no surprise that a 100% stock portfolio turned $1 into almost $156 and that a 0% stock (100% bond) portfolio was the least effective in generating wealth over that time period. Introducing the 60/40 Portfolio  One thing you may notice is that every portfolio tracked in the chart shown above gained a significant amount of money over the 50 year t...

Our Real Expectations For This Year

Image
  If each of us can replace just one interaction filled with hate to one drawn to love and just one reaction fueled by fear to one blessed with hope, then 2024 will be a VERY bright year. The best way to predict the future is to create it. Our future starts today!

Market Forecasting Is Folly!

Image
Market Forecasting Is Folly Last month we added a cash position to our efficient frontier. The effect was to lower our expected risk and expand the range of expected outcomes for our available set of portfolios. One of the key words we have been using is this idea of “expected” outcomes. There is an intentionally non-specific meaning to this word because it lies in the gray area between wild guess and ironclad guarantee. The market forecasters of the world make big headlines around this time of year similar to how meteorologists make predictions about the snowfall before winter in the northern US. The big question is: are these forecasts remotely accurate? The quick answer is: kinda, sorta, not really. Source : https://www.cxoadvisory.com/gurus/ What About The Data  There are numerous investing roundtables and guru retreats that lure us into the fire of predicting the future. Those of you who have seen me at events around this time of year know that I have a few canned market forec...